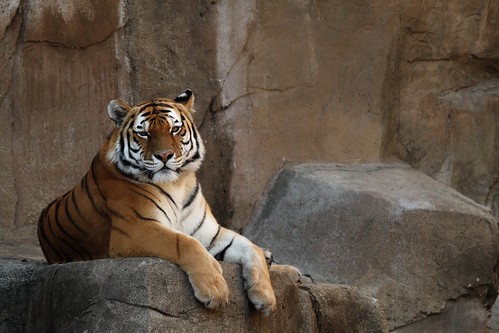
Feel free to download the photo here if you'd like to follow along with the exercise.
The problem with this photo is that it's dark, so the logical thing we might thing of to do would be to bring up the "Brightness/Contrast" tool (from the "Colors" menu) to fix it like this:
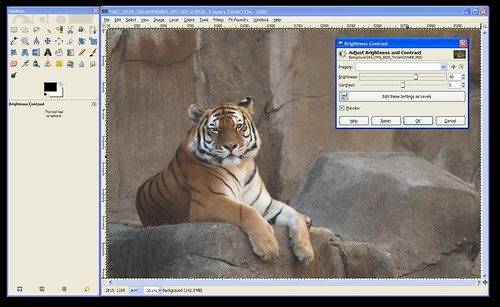
...but notice how increasing the brightness on the photo brightens the WHOLE photo leaving it looking dull and gray?
In this case, we want to brighten the white parts (the highlights) and the tiger's body and the rocks (the mid-tones) without brightening the darkest parts of the photos (like the shadows and his black stripes). The curves tool gives you the ability to brighten or darken the highlights, shadows, and mid-tones seperately. So, let's open it up!
The Curves tool can be found under the "Colors" menu. When you open the tool it'll look like this:
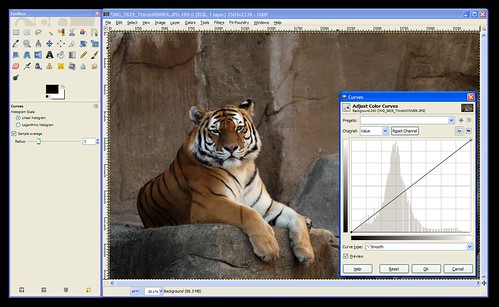
The Curves tool consists, mainly, of a graph. In the background is the histogram for your photo. If you don't know how to read a histogram, go back and read An Intro To Histograms right now because it's an important part of the curves tool.
Notice that the graph's "x-axis" (the horizontal part) is labelled (on the bottom) with a range of tones than go from black on the left to white on the right. Similarly, the "y-axis" (the vertical part) is labelled with white on the top and black on the bottom.
The histogram shows you the tones that comprise your image. In the case of this tiger photo, we can see that there are some dark tones, lots of mid-tones, and some highlights. Nothing's been over or under-exposed, so no detail is unrecoverable from the shadows or from the hightlights.
When the tool is first opened the line on the "curve" is actually a straight line that runs at a 45-degree angle from the blackest black on the graph to the whitest white. This is where all images start. If you click on this line you can pull it up or down. This is how you use "Curves".
Now, the first thing to consider is the portion of the curve that you want to pull up or down. Clicking towards the left will change the darker tones. Clicking towards the right will change the lighter tones. You can use the histogram to decide where to click or you can use the dropper tool to help you decide.
To use the dropper tool, simply hover your mouse over the photo while the Curves tool is open and click on the area you want to lighten or darken. In this case, click right between the tiger's eyes so we can see where we need to click on the "Curve" to brighten the darker areas of the tiger.
This will put a vertical line on your graph to show you where that tone that you clicked on lies on the x-axis of the graph. So, we now know that we'll need to click in that approximate area of our "Curve" (the 45-degree line).
Next, we need to decide if we're going to move it up or down. According to the label on the side of the graph pulling up will lighten the photo (bring the tones towards white), and pulling down will darken the photo (bring the tones down towards black).
We want to lighten this photo, so click the "Curve" (the 45-degree line) where the vertical line meets it and drag it up until it looks about right to you. When you have it where you want it let go of the mouse button to set that point on the curve.
At this point, your "curve" (graph) should look something like this:
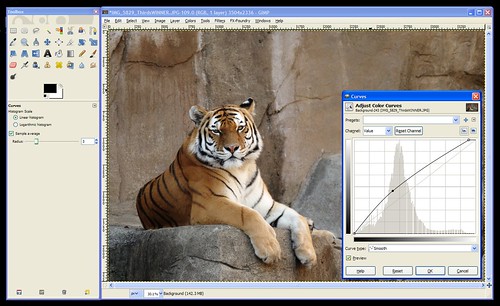
One more problem remains -notice that the histogram shows the data going down to nothing way before it reaches the right side of the graph? This means that my "whites" (the tiger's face and chest) aren't as white as they could be. To fix this you can either click the whitest part of the tiger to get that vertical line to show you where these tones are on your "curve" or you can just look at where the data ends and click somewhere close to that area on the curve. Then pull that point up to the very top to make it pure white. (This part was already done on the screenshot above.)
Click "OK" to apply the changes to the photo and you're done!
I'm going to go through one more example really quick so you can see another common curve: an "S" curve.
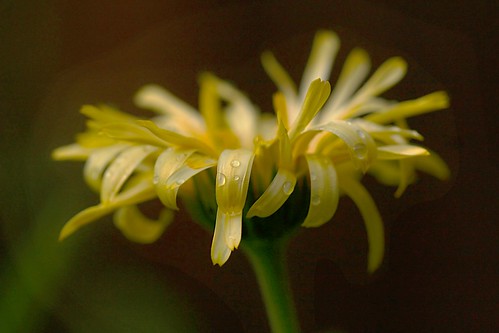
Here's the example photo we'll use for this one:
Download full size here.
You'll notice in this photo that the background needs to be darker, and the flower is a bit gray and needs to be made brighter.
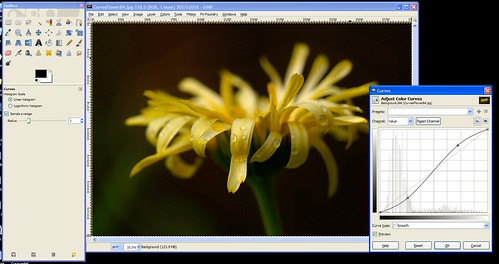
So, we'll open curves and bring the darks down darker and the highlights up brigher. The resulting curve looks like an "S" as shown here:
Hopefully that gives you a good idea about how to use the "Curves" tool. This tool will allow you to manually do what the "Auto-Level" did for our photos in Exercise #4. If Auto-Levels doesn't work for you, you should be able to fix your photo manually in Curves.
As always, feel free to post your questions, tips for using Curves, or the results you've gotten with this tool here.
1 comment:
Outstanding lesson. Very straight forward and easy to understand. The visual examples make a big difference. Thanks!
...Ken from Photography Beginners
Post a Comment