It's nearly impossible to tell if a photo you've just taken is too light or too dark (or "exposed properly") on your camera's LCD screen. In bright sunlight you have to shade the screen with your hand, then squint and zoom and in the end you really have no idea until you view it full size on a screen. Even under the best lighting conditions it's difficult to evaluate exposure on the LCD screen because the brightness on the screen itself can be adjusted -so is it right? or just right on your tiny LCD screen? This is where your histogram comes in handy!
Before we get to what the histogram is, let me break down the term "tone" for you (sometimes people get confused by what a color's "tone" really is). By tone, I mean how dark or light a color is. Any color. In other words, if you converted the photo to black and white, it's all the shades of gray between black and white.
So, your histogram will show all the tones in your photo in a graph that goes from black (usually on the left) to white (on the right). You can think about it like this: it converts your photo to black and white, then takes all the pixels and lines them up on the graph -all the black ones are on the far right, then 99% black, 98% black, etc all the way down the line to pure white on the right. ...it's an interesting but abstract thing to do, right?
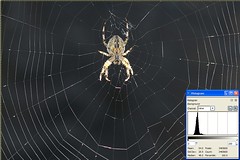
So, here's why it's useful... If your graph shows a lot of data on the far left (black) side of the graph, you have no detail there. That means, no matter how much you lighten it in post-processing you'll never be able to get anything out of those areas -they are pure black.
Of course, a lot of black isn't bad for all photos. -If we're talking about a photo of a person with a pure black background a lot of pure black would be expected. But, if it's a photo of a bird up in a tree, it's probably under-exposed.
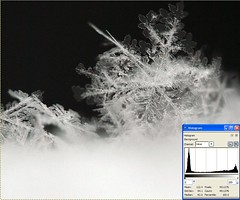
Likewise, if the histogram shows a lot of data on the far right side (towards white), then you have very little detail in the highlights of the photo. But, again, if you took a photo with a pure white background that would be expected. If you wanted detail in the white areas of the photo, however, you'd want to re-take the photo so the data doesn't run off the right side of the graph. (It should peak, then go back down before the graph ends on the right-side.)
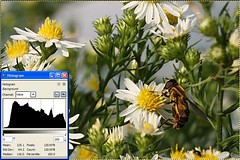
It's difficult to understand the idea of using these graphs unless you see them, so here are a few examples of some photos and their histograms. The first 3 are kindof extreme examples, the 4th is a more normal photo. Note that on that one the data runs off the right-side of the graph (I overexposed it a bit!).
(Click on the photo for a larger version and an explanation of what the histogram shows.)

If you don't understand something or have trouble with any of my tips, feel free to contact me via a comment on this (or any) article, or see my website for my email address and I'll be happy to help you out!
No comments:
Post a Comment